July 9, 2018: S&P500 Bulletin Review
The fall of February 2018 was something unexpected, and when it happened, we clearly said we did not believe in any new downtrend. Ergo: it had to be a BUY OPPORTUNITY.
To support our analysis, we provided a Key Area from an interesting study of February 6, 2018; you can download here (in PFD), which can be useful for the future too.
In the Special Update, we ended up saying:
In trading, statements are very dangerous when we try to forecast the future. It is always better we speak in terms of statistics. If you agree with me, we can state that:
- the parabolic pattern of the 2017 has been probably broken after the breakout and down acceleration under 2800 points.
- if we see the drop to continue from the top of January 2018, we should pay attention to a possible support in area 2545-2576 points to maintain the uptrend that lasts since 2009.
- we should not rush in opening mid-term SHORT positions, because Markets usually developed a sideways movement or new intermediate tops before a strong downtrend.
- in the situations where the downtrend began immediately, that movement did not lastlong; we can expect the same from the actual drop.
In my opinion, the down push began the movement in a too strong way for a new real downtrend. If we do see a crash, I believe it is again a new buy opportunity, we just need to wait for the best supports, without trying to anticipate the Market. If a bear Market is about to begin, it will not begin with a crash after three days the S&P500 did the highest High. These are all suppositions looking at the past…
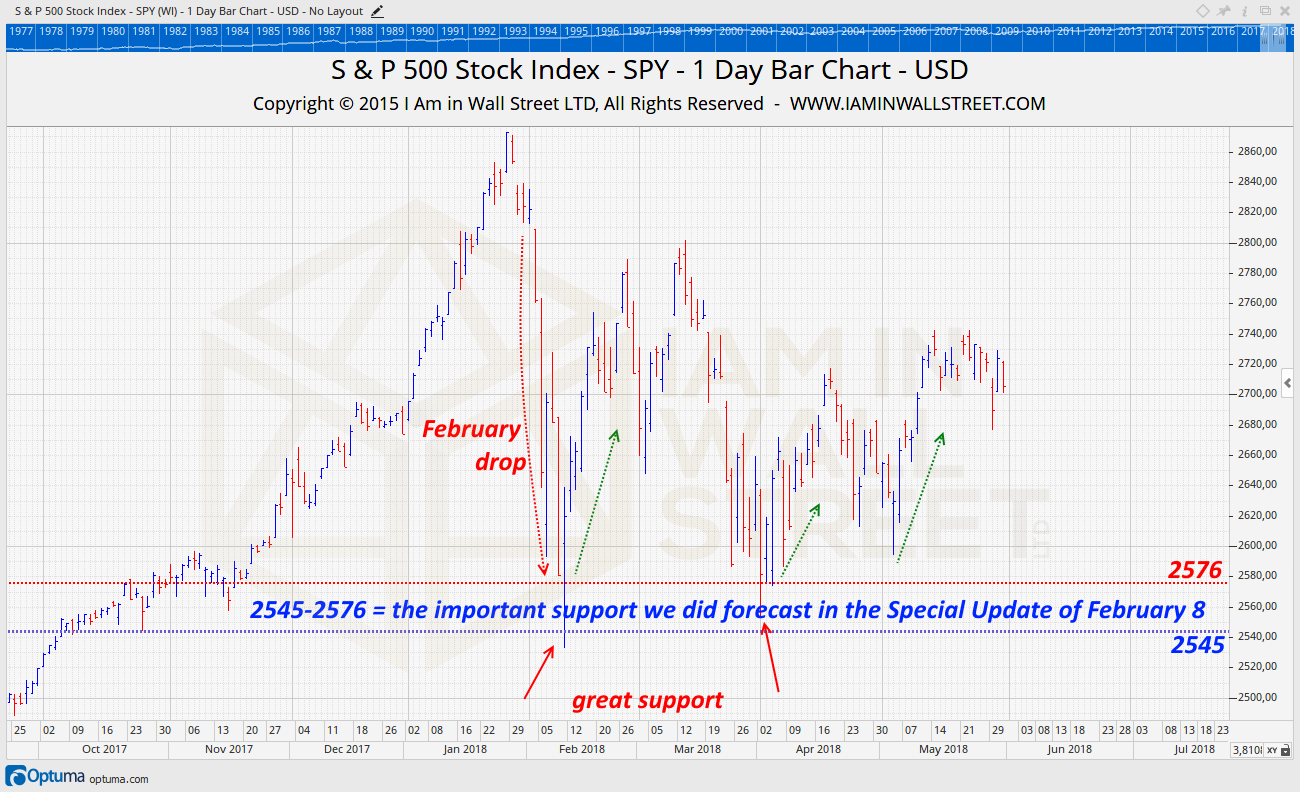
The analysis we provided on February was right, we said to follow the uptrend, and it was also what we said in the 2018 Bulletin we issued in 2017.
The uptrend will not work forever, of course! Our last 2018 S&P500 Bulletin Update has been sent out on June 1, 2018, where we suggests the next intermediate top of the year and which levels we should monitor for the top. The next Update will be issued in a few weeks.
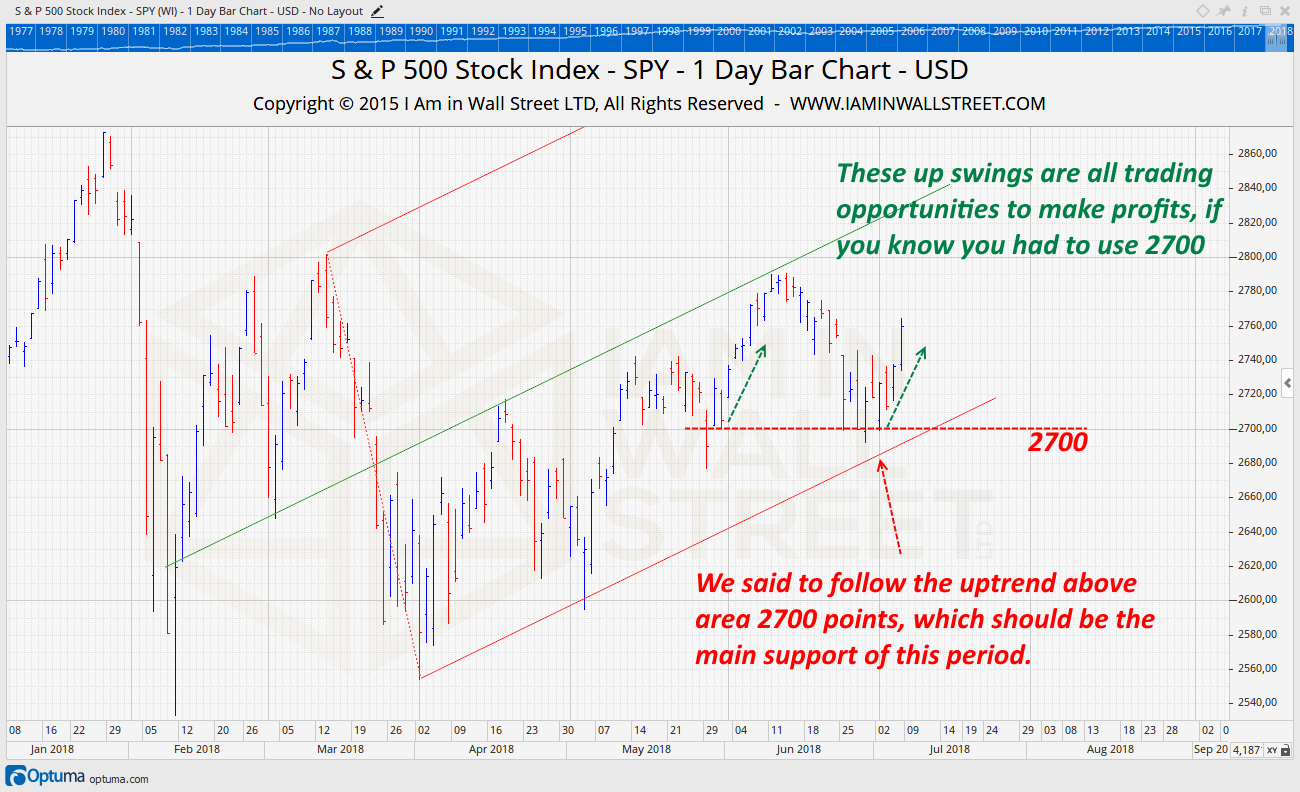
In the mean time, on June 1, 2018, we also suggested to follow the uptrend above the area 2700 points, which is the right support of the last weeks:
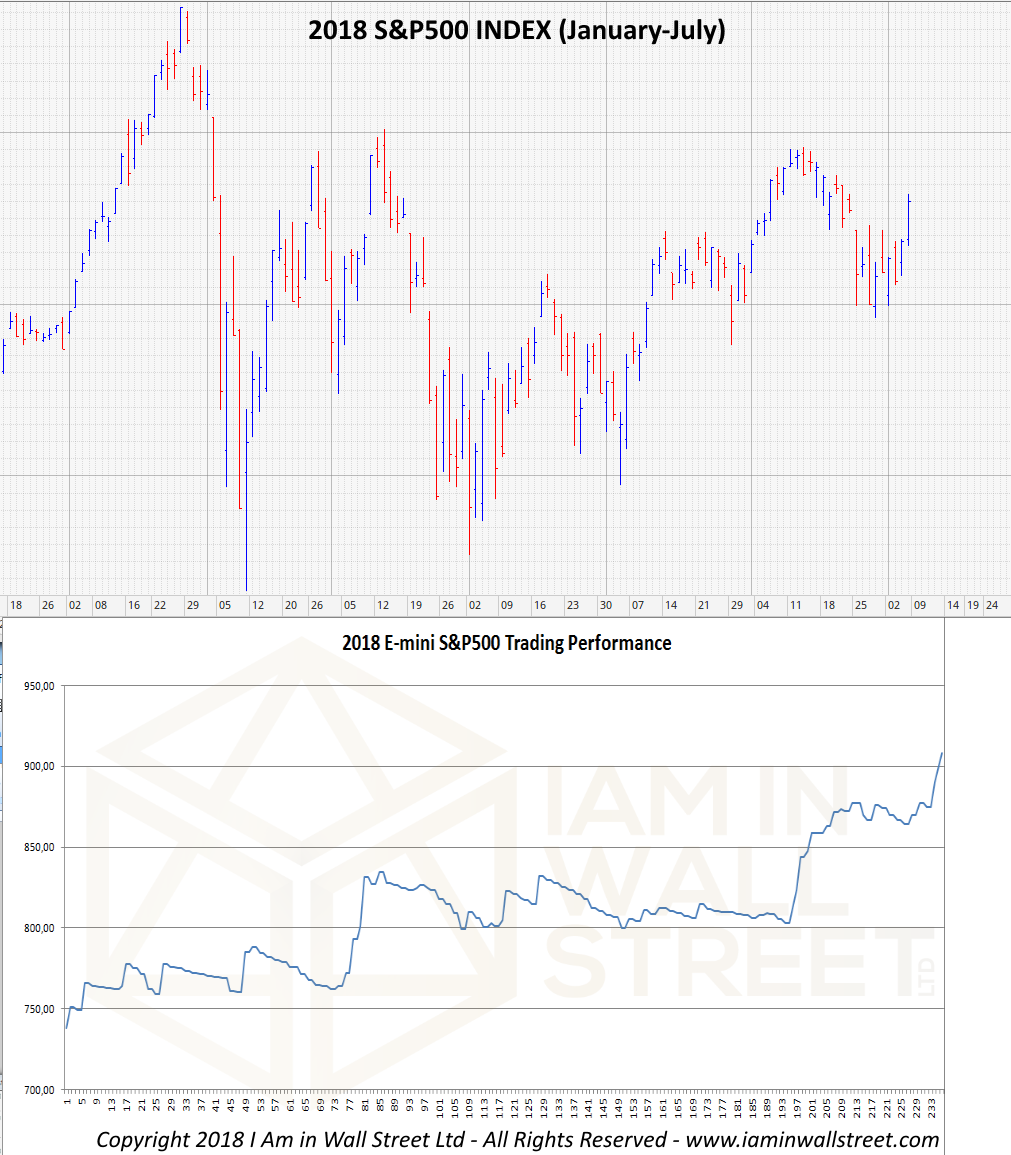
2018 S&P500 Trading Strategy Performance
In our Daily Report Service, we provide a precise, day by day, demanding trading strategy for Futures. This is the strategy we own, and we show it in real-time, every day, through a new feature The Screen Sharing Service, included in the Daily Report Service. The Screen Sharing Service allows you to see, via web or via TeamViewer all the orders, positions and balance in real-time or the account the uses real-time Market data, all day long during the US Daily Session (yes, we do something no one does, because in this way we cannot cheat!). Our performance is beating hardly the Market, so far, with a performance of 170 points per contract (until July 6):
July 12, 2018: Corn & Soybeans Bulletin Review
Corn and Soybeans suffered the trade war, and this situation affected dramatically the prices. Our forecast model worked very well until the end of May, where we could make good profits taking advantage of the positive trend, as we did forecast.
Here below, in the chart, you can see what we said in the update of February 2018:
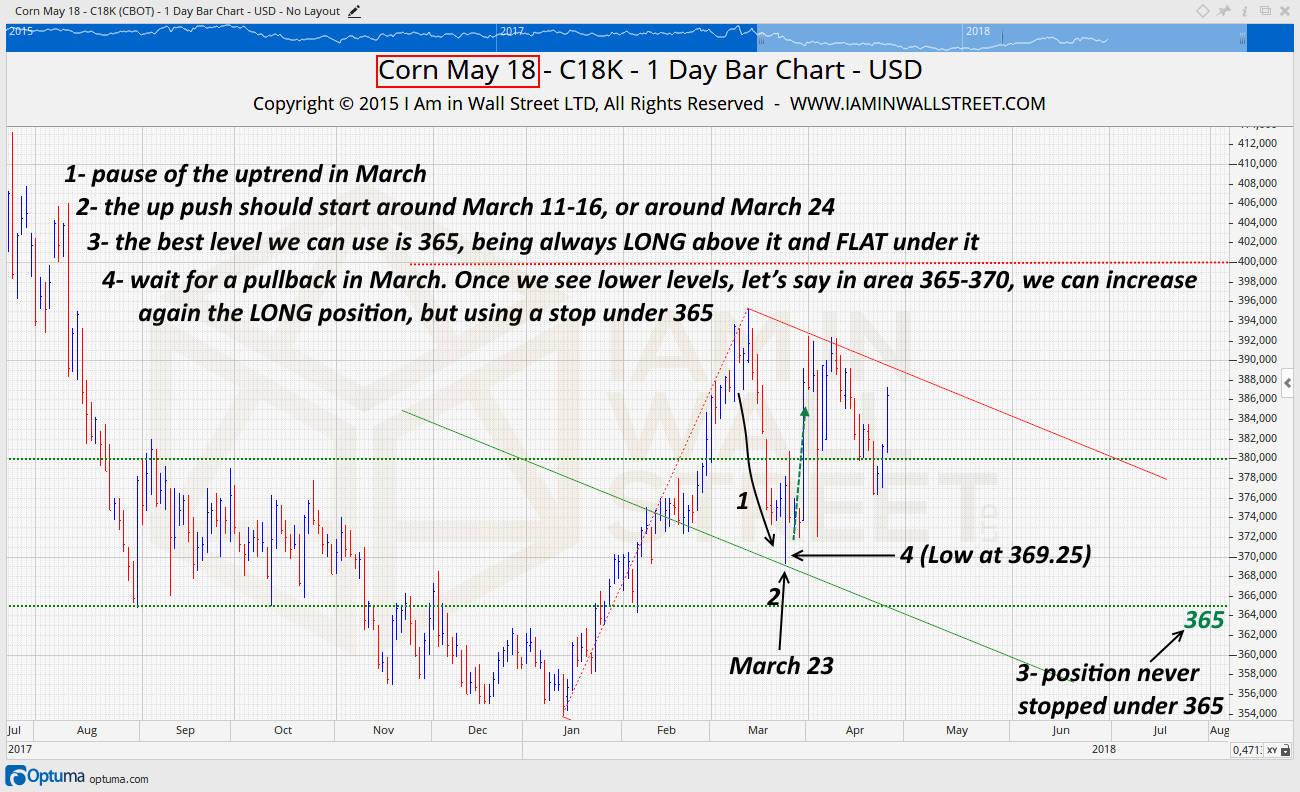
In the Update of April 26, we confirmed a continuation of the uptrend, and we said that Corn should remain up at least until June but… At the end of May, Trump announced the beginning of the trade war, and Corn pushed strongly down:
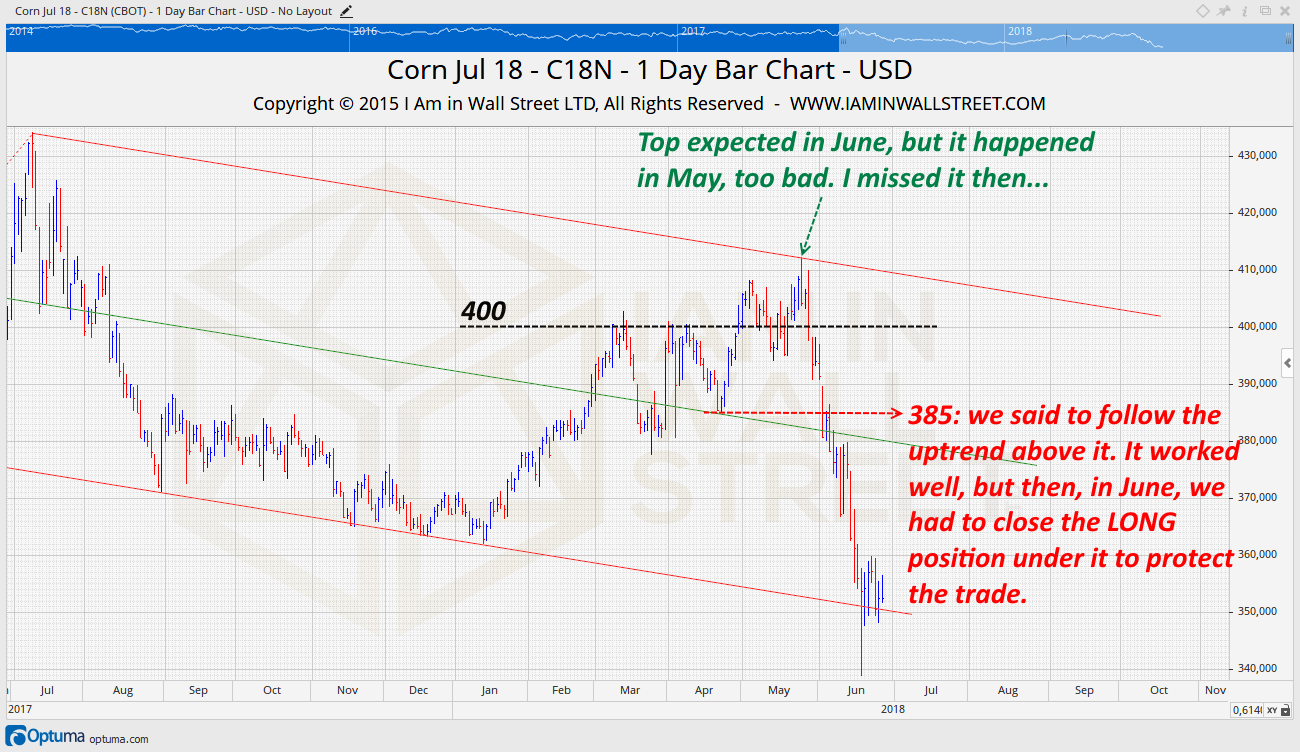
Our analysis was perfect until the end of May, where we can see the effect of the trade war between USA and China. We were using the Key Level at 385 to follow the uptrend, and we had to close the LONG position under it (this is part of trading, and STOPS are fundamental if you want to trade the Market wisely).
The last Update has been sent out to the subscribers on June 28. Attention today, there is the WASDE Report at Noon!
In the same way, Soybeans pushed strongly down from the end of May. Before that time, our analysis was working well, and we made some profits with it:
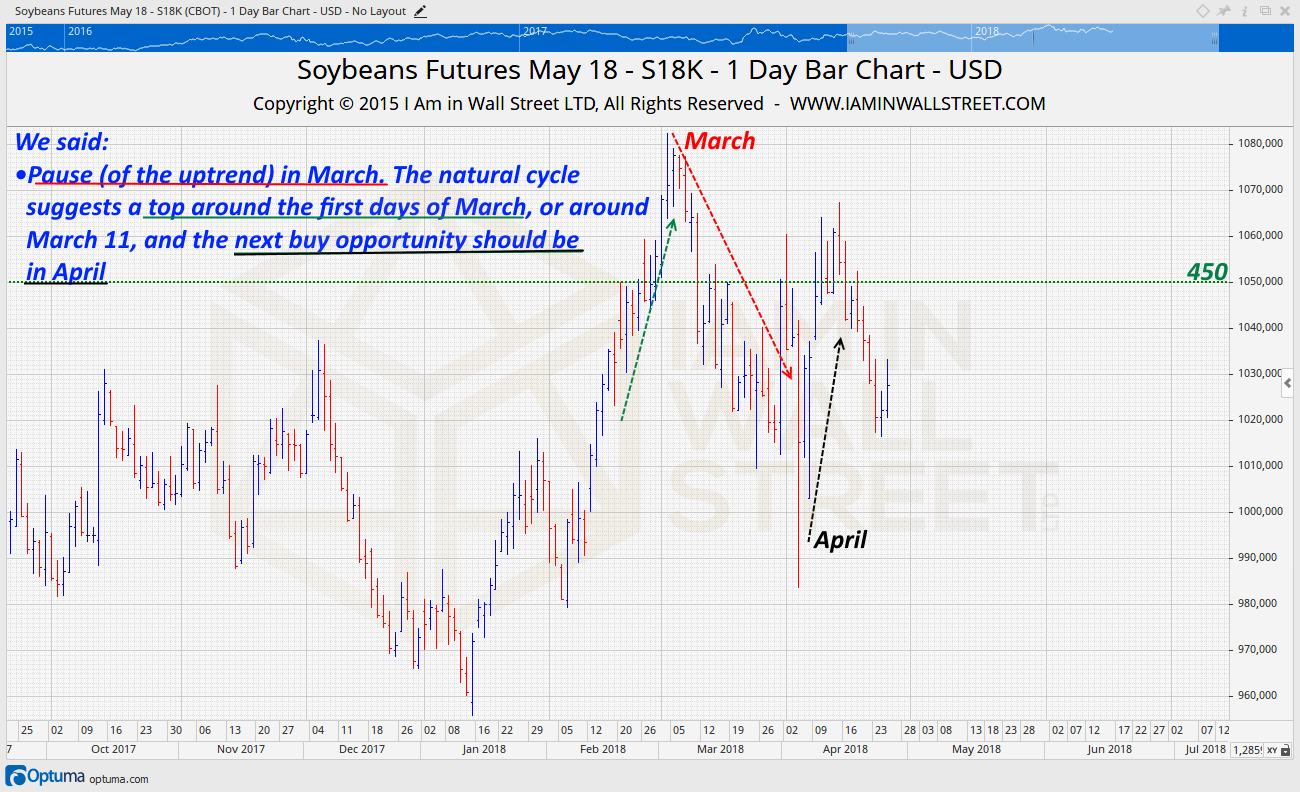
To protect the LONG position, we said to use the level 980-997, where we had to be always LONG above it and FLAT under it, with the July 2018 Contract. Even with this Commodity, our Key Level supported the Market (Low of May at our Key Area), but in June we see a breakout under it, and that was the time where to give up with the uptrend and close the LONG positions.
Hence, we had to deal with a tough Market, affected by external events. We are well aware things like that can happen in any time, that’s why we always provide important levels to trade wisely the Market. Trading is made by profits and losses. In the end, it is important we have bigger profits than losses.
How can I have bigger profits than losses?
The solution is in the STOP-LOSS orders. We must cut the losses, knowing in advance where the “make or break” levels are. These levels are energy points, where we can expect them working as supports or resistances… or significant breakout accelerations.
July 9, 2018: Cotton Bulletin Review
Just perfect, or almost perfect. I guess it is enough we show you the 2018 Cotton Price Forecast that we issued at the end of 2017, to make you realize the power of our Cotton Forecast:
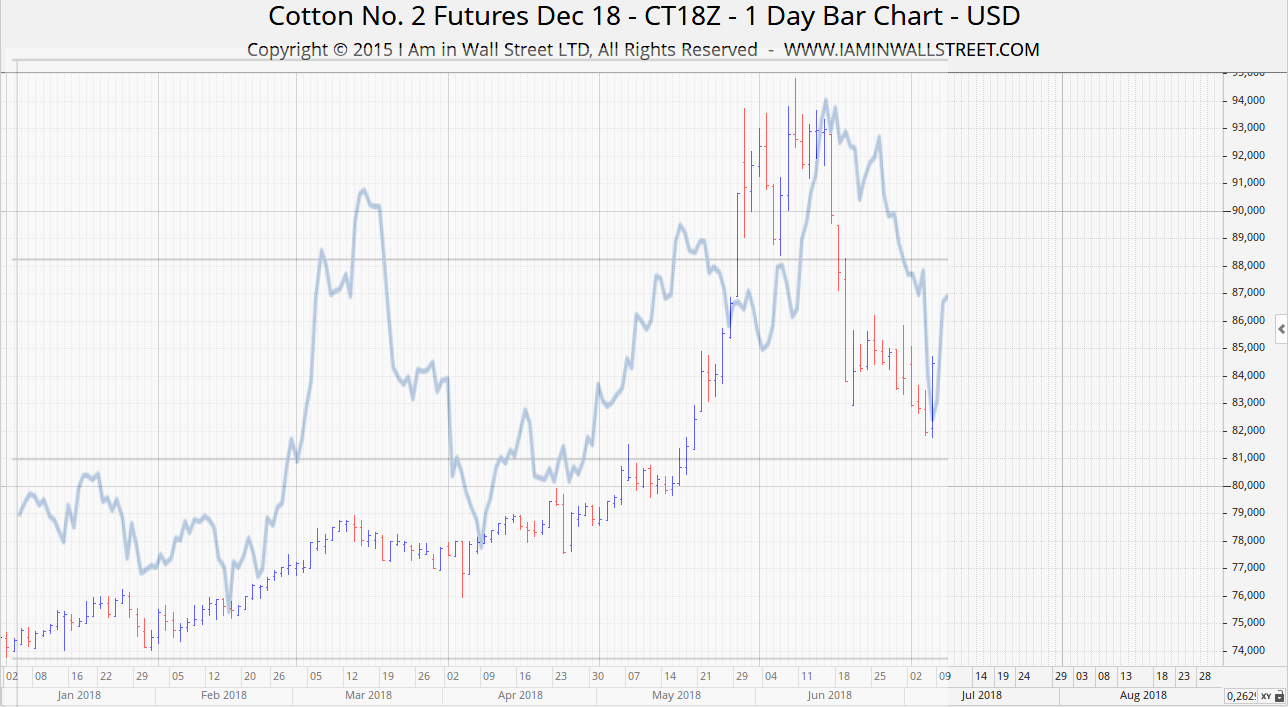
Our Cotton Forecast Model has worked very well, so far.
We have also sent Updates at every Contract Expiration, providing the levels and a general strategy we should use to trade Cotton with an intelligent approach.
