
The 2026 S&P500 Forecast & Strategy Bulletin is available now. If you want to see the future, this is a good opportunity to do so with a high probability of success. Why can I say so? What we have done in the last few years suggests we will be right again. Do you want to miss the 2026 S&P500 Forecast?
What does the 2026 S&P500 Forecast & Strategy include?
- The 2026 S&P 500 Annual Bulletin includes a commentary on what we expect to see during the year, how to approach it, and the most important time windows where we forecast essential buying or selling opportunities, along with precise Key Dates where we expect a change in trend or acceleration.
- An Excel File with the 2026 Forecast Model
- A Weekly Report for the entire year with a detailed analysis (EVERY WEEK!).
The best way to judge my work is to see how I have worked in the past. I share the correct and incorrect calls. I am not here to say that I am infallible. Sometimes, I am wrong, but history says I am correct most of the time. Judge yourself here below.
Judge my work from the past.
The year 2023 was a good one for us; the forecast covering the S&P500 worked perfectly in the first half of the year. We forecasted a low in January and March, and then we forecasted a new uptrend from March to mid-June 2023.
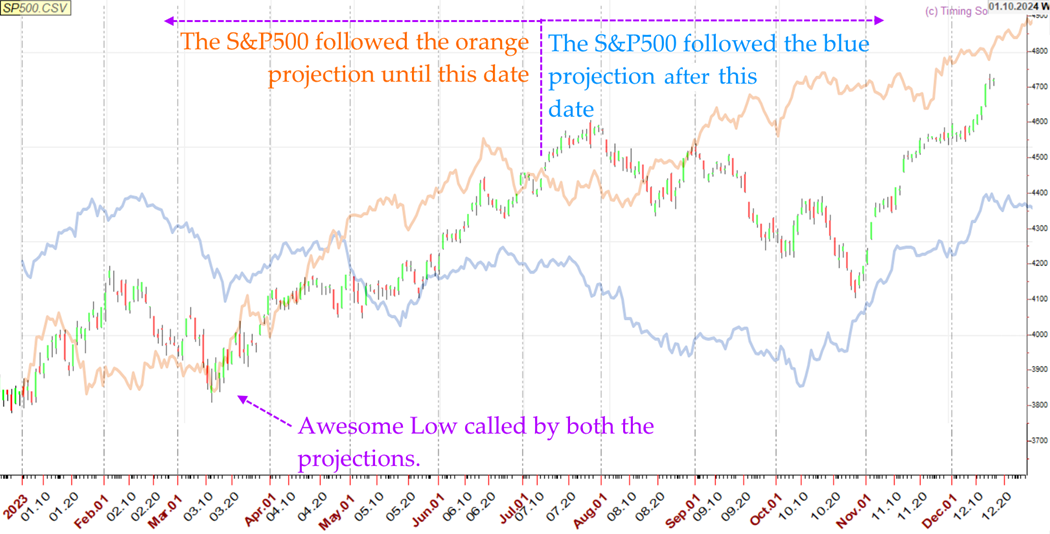
You can precisely see how both the projections could call a Low and buying opportunity in March 2023. The Orange line is usually my primary guide, while the Blue line, which I call the short-term projection, is a secondary path. Usually, the forecast becomes very reliable when they work in sync.
In June, we were expecting the beginning of a new pullback until August; when we saw the August Low being broken in September, we said to wait for October 4-6, 2023, for a new buying opportunity, and then on October 27, 2023. You see how both the calls were correct; above all, on October 27, 2023, we called it a buying opportunity right at the day. When the market deviates from the Orange line, it usually takes a different momentary path, but then it tends to line up to the Orange line again, as it happened with the strong upswing started on October 27, 2023.
This is precisely what I wrote to my clients on October 27, 2023, through an Update, then judge by yourself:
“We are seeing a tough market, and I could not see it coming, to be honest, even if the breakout under the August Low could be a first signal of unexpected weakness. In the last Update, we mentioned October 3-6, which became a Low as we did forecast; we used it to buy, with the possibility to take some partial profits during the upswing, but in the last 10 days, new drop, moving even lower than October 4 Low. I am very angry because I was not expecting it at all, and in the last two months, my forecast has been failing! Nothing has suggested this scenario to me in recent months.
Today, I am writing to you because I believe that today we have a new buying opportunity, a new Key Date that should create a Low for higher levels. I work with 4141 FP or 4197 FP (December Contract) to open LONG positions above them and use stop-loss orders under them. However, it is a delicate moment, and I do not know if it may be affected by the Middle East tension! But sure, the Gold market turned very bullish because of that, and big funds may have dropped stocks for gold… just my supposition.
If the Market keeps dropping after Monday, I will probably remain FLAT, waiting for mid-November, when I have a new Key Date for a new trading opportunity.”
This Update was released the same very day of the Low, on October 27, 2023. When the market does something unexpected, we keep working with our timing analysis to find new opportunities. The forecast model provides a general path, but then I send updates to provide precise key dates with which to work.
2022 S&P Forecast & Strategy Bulletin Review
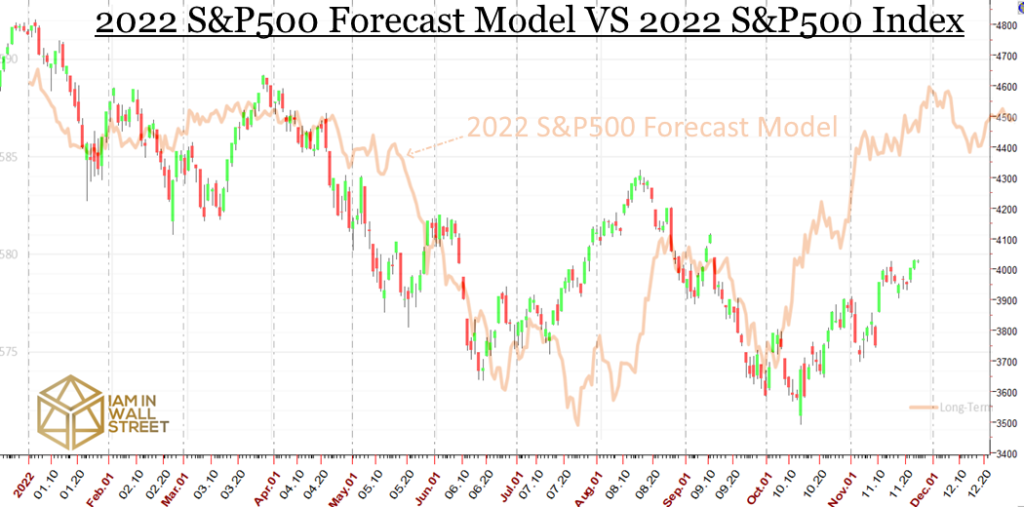
Look at the 2022 S&P500 Forecast Model compared to the 2023 S&P500 market below. Do I need to explain it?!? I guess you can see with your own eyes that I was able to provide a wonderful forecast, released one year in advance. Do you know I said to SHORT under 4770-4800 points in January 2022?
We forecasted a downtrend from January 2022 to June/July, up until the end of August, down to October 2022, and then up again. Ops, we did not make a mistake! And the 2022 Forecast was issued in December 2021.
In the 2022 S&P500 Forecast Bulletin, we also provided a clean chart to explain our expectations…
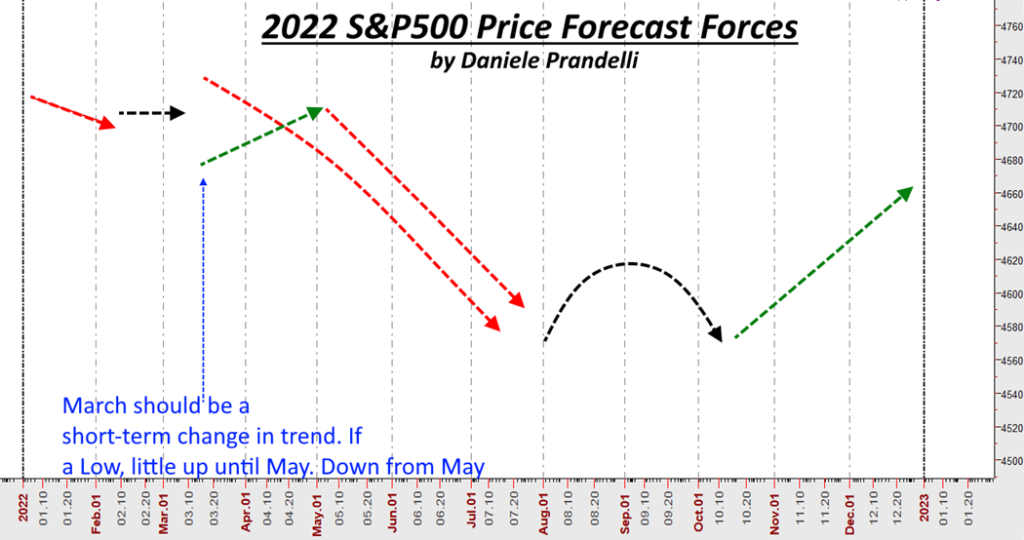
Here below is the Market compared to the Forecast Model:
2020 S&P Forecast & Strategy Bulletin Review
We all know that 2020 was a controversial year. Look at how my 2020 Forecast Model forecasted perfectly the 2020 Low of the Year after the crash due to COVID-19. I want to remind you that the forecast was released in December 2019:
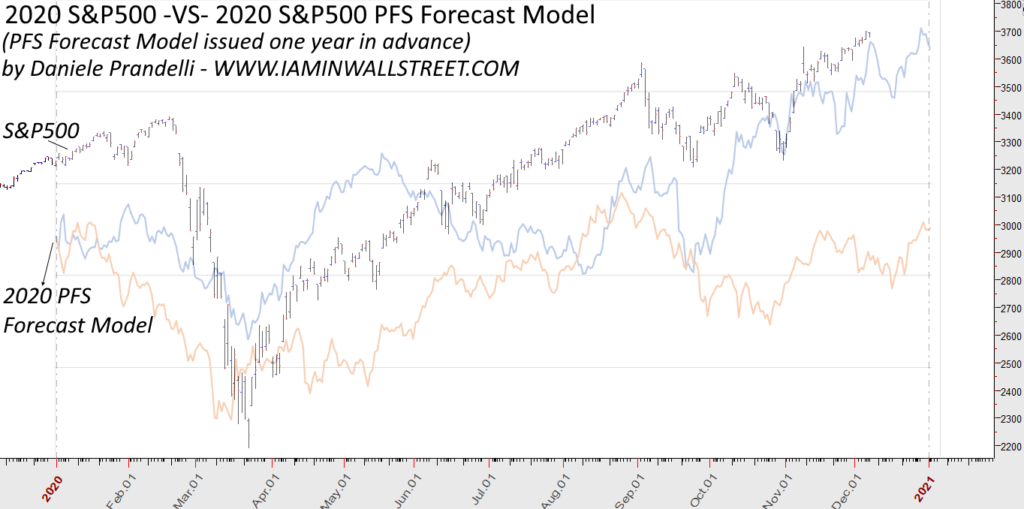
The 2020 S&P500 Forecast Model has been able to forecast:
- The High and the Low of the year almost at the day (you do not believe it, but it is right there, in front of you, and if you have my Forecast Model course, you know that this is real, created in advance because you did it too, mathematically, without any discretionary choice)
- The descent from January/February to March 20-23
- The uptrend until December
The 2025 can be harder than expected…
If you do not trust my words, you should trust the facts:
- Watch my Activity Statements, where I trade my forecasts and strategies
- Read the free Post I wrote on March 26, 2020
- Read my Comment on Linkedin, when I said that the Low was in at the end of March 2020: https://www.linkedin.com/feed/update/urn:li:activity:6649162465454157824/?commentUrn=urn%3Ali%3Acomment%3A(activity%3A6649070798441111552%2C6649162363805188096)
- Read my amazing Comment on Linkedin when I said that all the people were about to be wrong because they were very negative about the Market; it was the beginning of April 2020: https://www.linkedin.com/feed/update/urn:li:activity:6653785791824711680/?commentUrn=urn%3Ali%3Acomment%3A(activity%3A6653445638216392704%2C6653785668302446592)
I cannot cheat with LinkedIn comments!
The 2025 Forecast & Strategy Bulletin is now ready.
I cannot promise anything because I am not here to tell you that I am infallible; I speak with my hard work, and you deserve it only if you spend time checking it. You can download all my 2019-2023 bulletins and updates that I have provided in the last few years (it is a Dropbox shared folder where you can download all the files of my annual bulletins). Read all and judge it. Please take 30 minutes of your life and judge my work. It may save you in the future.
I have professional traders, managers from banks, and CEOs in the commodity industry who regularly order my work. Most of the time people do not subscribe to my work because they do not believe it is possible to do what I do. For this reason, I made available the entire work of the last years, covering all the Bulletins.
DOWNLOAD MY ORIGINAL 2019-2023 ANNUAL BULLETINS and UPDATES
You can also download the work covering Corn, Soybeans, Live Cattle, and Cotton.
What do you get ordering the 2025 S&P500 Forecast & Strategy Bulletin?
A complete 2025 Forecast Model + Most favorite Key Dates and swings of the year.
The Annual Forecast Model is based on the PFS forecast model, created by Daniele Prandelli to increase the probability of knowing in advance the most reliable trend. The PFS, linked with the Price Map, becomes a strong tool to trade wisely, following the right trend and immediately cutting potential losses.
2025 Forces Chart: a new chart where we show the favorite trend in different periods of the year; we have created this chart to explain better the phases of up pushes and down pushes; there are months of the year when a new movement should begin, and we know, most of the times, the right direction of these forces.
When we study the Annual Forecast, we have several time windows where we can call Market situations with a high percentage of success; for example, sometimes, we can predict which is the best month to buy or sell or when we should expect the beginning of new up pushes. These time windows are summed up in the comment of the Annual Bulletin.
We provide precise Key Dates, very important and practically fundamental for my work, where we can spot a High, a Low, or a change of state within a time window of two or three days. These Key Dates allow us to trade and read the market precisely.
Every week, I email a recap of the analysis, reading the actual situation and how I intend to trade in that moment.
REMIND THIS! – We do not believe in blind strategies based on forecasts; we use a specific strategy based on the Price Map we develop for each Market we trade. We follow our forecast, but only when the Price Map supports it.