
Buy in March 2020: I said it in 2009
- June 8, 2020
- Posted by: Daniele Prandelli
- Categories: Forecast, S&P500, Trading
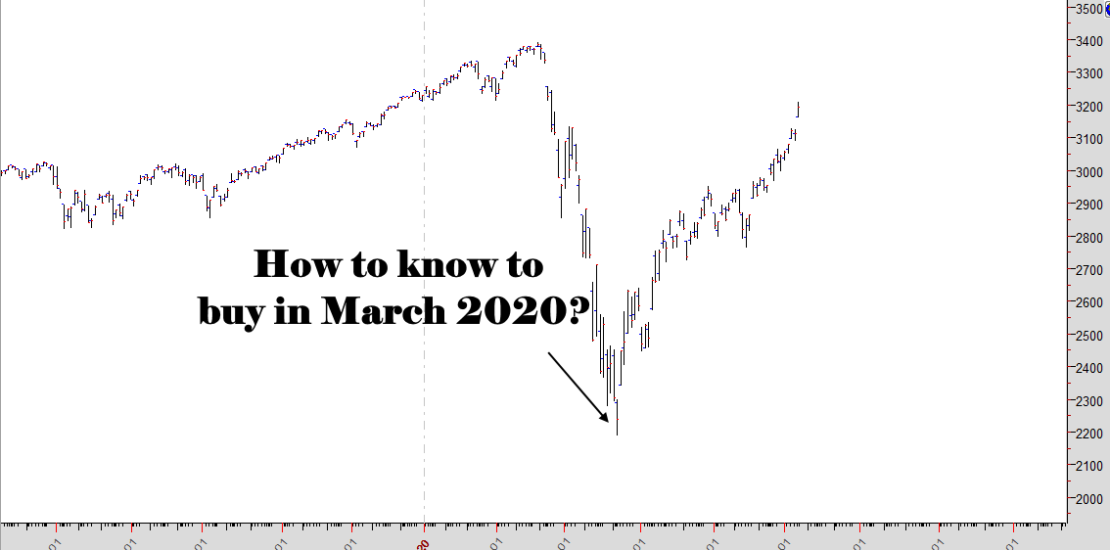
How I said that March 2020 was a buy opportunity for Stocks, 11 years in advance… I can prove it because I wrote it in a book… Today, I show this study to you… You only need to be able to make additions… If you have followed me in the last months, I told you since the beginning that I did not trust the fall…
Again the same fake-story? Nope, and I can prove that! I really did say that march 2020 was a buying opportunity for the S&P500, and I said it 11 years ago. Actually, I did not say it, I wrote it! Today I show you the study that made me call March 2020 as a buying opportunity, and I did it in 2009.
The Proof of My Call
In 2009, I wrote a book/course for Sacred Science Institute, where I mainly spoke about the Gann Planetary Lines, how I use them, and I cover some cycles that I found out after studying Bayer’s material. The title of the book is “The Law of Cause and Effect“.
In the last chapter of the book, I showed a “work in progress” which was a study that I was investigating at that time. That study offered two countings to forecast potential selling months and buying months. However, as I said in the book, that section was just something to investigate, because I did not know if it was something casual or if there was a real “market law” behind it.
Let me say immediately that I have not been able to develop a precise rule that could help me to rely a solid strategy with that method, and I gave up making more studies, despite this discovery showed me amazing results. Maybe, after I show it to you, you will be able to find out more.
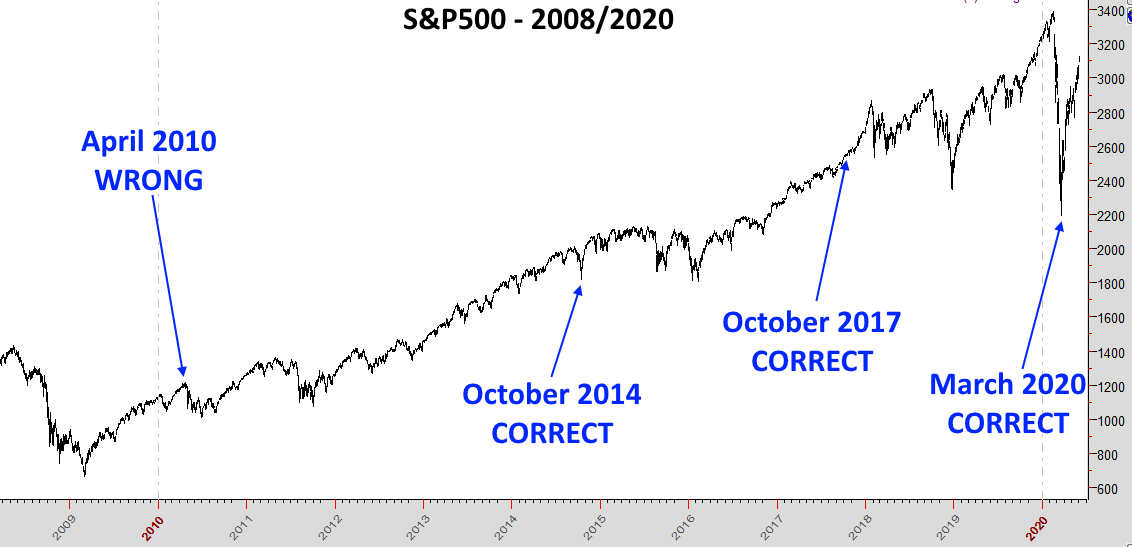
There is no doubt that this system called for a buying opportunity in March 2020 for Stocks. It also did call a buying opportunity in April 2010, October 2014, October 2017, and March 2020, as I said. The potential next buy opportunity is in April 2024. The book was written in 2009, and if you check the suggested months where to buy, they have been excellent, except for April 2010, which was not a good buy opportunity. So, in the last 10 years, we have 4 monthly buy opportunities, 3 turned out being correct, and only one was wrong. Two of them hit the Low of important drops.
This is a chart of the last 11 years, where I show the buy-timings of this system:
I will show here how this system is working very nicely since 1970, sharing with you the numerology behind it.
How Does the System Work?
Here is an extract of the Book “The Law of Cause and Effect”, chapter 6, titled “MATERIAL FOR STUDY & REFLECTION – A NEW TIME SYSTEM”:
I intuited that it was possible to create a calculation based on years, intersected by a calculation based on months. The resulting geometries can be applied to either the longest or the shortest Time Frame. I am going to preface the following material by saying that identifying such calculations is a very difficult task and I am still seeking further elaboration of this concept. In short, I am revealing a work in progress.
As a further complication, the calculation for the years or months is not based on a harmonic that can be fixed such as 2+2+2+2+2+…. Instead the calculations are based on 2, 3 or 4 different numbers such as (+3+3+4)+(+3+3+4)+(+3+3+4)+…, the actual basis of our cyclical sequence (+3+3+4). As a next step, we will establish a succession of numbers indicating the interval in months until an expected reversal. The reversal may be based, for example on the sequence (10-10-3-4) (10-10-3-4), etc., or said another way, (October, October, March, April). Combined with the previously determined yearly sequence, we now know that the reversals will happen in a particular year in October, the next year in October, then March and lastly April (in the months corresponding to 10-10-3-4). This method has proven to correctly identify significant lows and/or buying opportunities consistently over the past 40 years.
The following table demonstrates the calculation of the sequence from the starting year of 1970.

To calculate the years, begin at 1970 and add the repeating sequence +4, +3, +3: +4+3+3+4+3+3+4+3+3+4+3+3+4+3+3, etc. The chart above delineates the years from 1970 to 2014.
To calculate the months, again begin from 1970. The series of months is: April, October, October, March. (Important Note: Inserting the months does not require a calculation! Just repeat the four-beat sequence; April, October, October, March, and repeat.
In the matrix above, 1970 intersects with April, 1974 intersects with October, 1977 with October, 1980 with March, 1984 with April, 1987 with October, 1990 with October, 1993 with March, 1997 with April… and so on.
I let you check how this system worked since 1970. It has been able to hit very important lows that became exceptional timings to buy.
Conclusion
As I said at the beginning, 11 years ago I published a course which included a system that provides potential buy opportunities for the S&P500. After October 2017, the next buy opportunity was in March 2020. Did it work correctly? Absolutely yes! One of the best buy opportunities in stocks ever! The next one will be in April 2024.
This method is strange, I know, but cycles may work in this way too. Our logic is not the same logic of the market. And about this, I am going to write the next Post showing that I perfectly did forecast the actual scenario, with an incredible new bull market. It was not hard, I just looked at the crowd and I understood that they were all wrong.
Is this based on WD Gann, Price and Time?
Hi, I prefer to say that it is based on my own researches about the time 🙂 Obviously, Gann and others inspired me in my researches.