- April 8, 2020
- Posted by: Daniele Prandelli
- Categories: Forecast, Gold

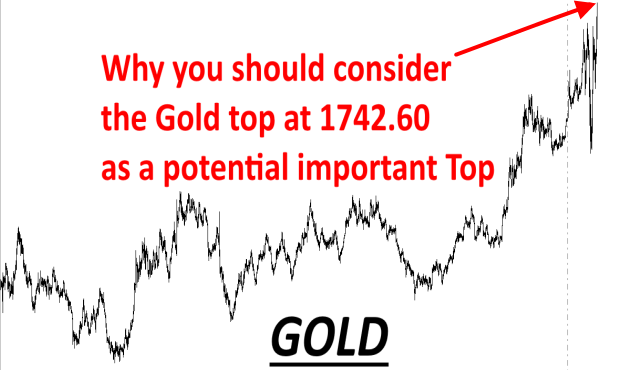
On April 7, 2020, Gold has reached a High at 1742.60. There are a few reasons we should consider now because the level 1742.60 has the potential to be a significant-top, or at least a significant reference point.
Why do I say so? As always, we look at the past and we look at the beauty of the geometry. Usually, people can show these things only when it is too late. Well, as I kept saying you that the Stocks crash was about to be a great buy opportunity around mid-March, I am saying today what I think about Gold.
Let’s go straight to the point. Here are some “coincidences” that make the level 1742.60 as a potential top:
-
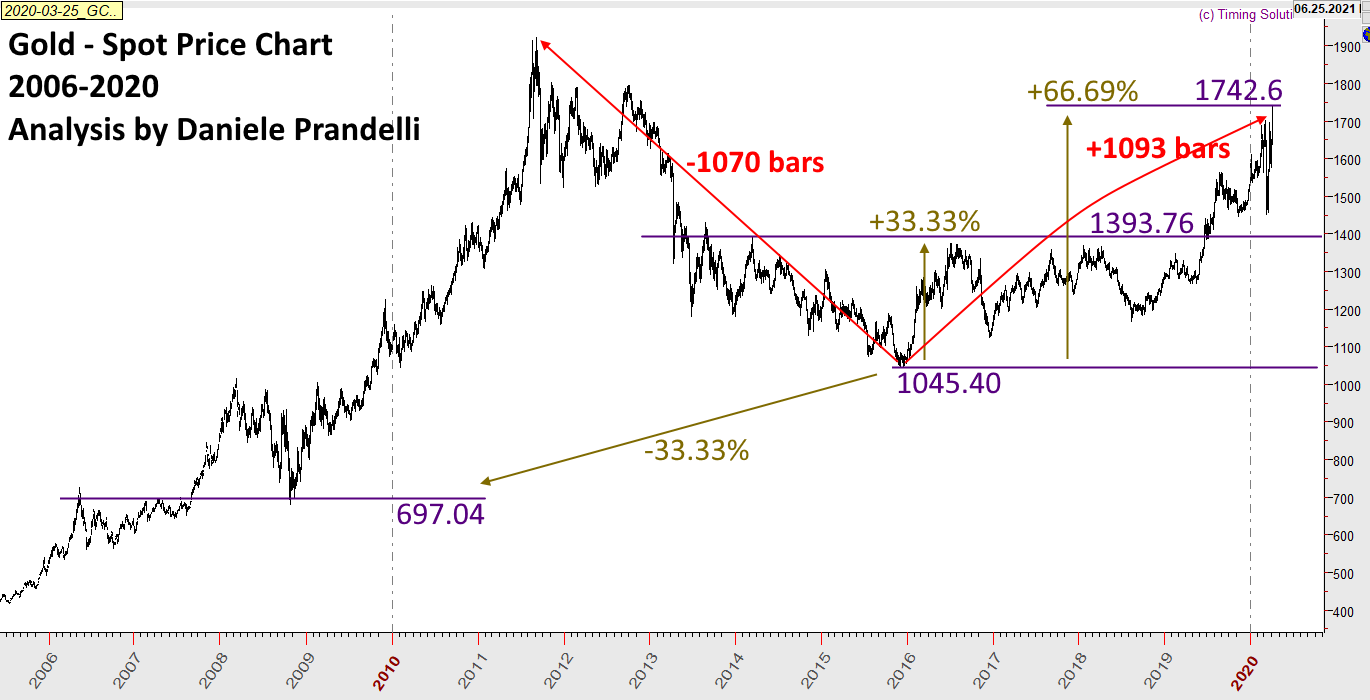
The Low of the last decade is in 2015 at 1045.40.
-
From the Low to the High, we see +66.69%. It means that Gold moved exactly 2/3 higher.
-
1/3 of 1045.40 is 348.36. If you add 1/3 (348.36) to the Low of 1045.40, you reach 1393.76, which is also a long-term key level, because Gold remained sideways under this level until 2019, and once broken, a new uptrend began.
-
Let’s go back! 1045.48 – 348.36 = 697.04. If you look at what happened at this level in 2006-2008, you see this was again a long-term key level, which worked as a resistance area for 2 years, and then it worked as a support in 2008.
Let me add a timing coincidence: the famous 2011 top happened 1070 trading days before the 2015’s Low. We are now at +1093 trading days from 2015’s Low. Just a timing coincidence? Maybe, who knows, we will see.
The following chart sums up the analysis:

Be aware that this analysis is not telling you: go SHORT all-in with Gold! The purpose of this analysis, as any analysis to trade the market, is supposed to create favorite scenarios to increase the odds to make a profitable trade. Then, behind the analysis, there must be always a strategy, and that’s what I do in my Daily Reports. In my Trading Performance, you do not see every trade in profit, but you see that over time, we make bigger profits than losses. This is the result of how we use the analysis.
