
Here is the expected pullback of Soybeans… look at this study…
- March 12, 2018
- Posted by: Daniele Prandelli
- Categories: Astro Trading, Gann, Soybeans
There are many studies I use to forecast and trade the Soybeans Market, which is one of my favoite. Let’s see, here, why we had to expect a pullback considering the work of Jeanne Long.
WHAT HAPPENED TO SOYBEANS IN THE LAST TWO WEEKS?
The Soybeans Market pushed strongly up from January to the first days of March. We were able to make good profits thanks to our forecast (we published it in December in the 2018 Grains Bulletin). On the first of March, I stated, here, that Soybeans had to take a pause from the uptrend; again, a good call (even telling things before they happen, people hardly believe me, that’s incredible!). We are seeing the expected pause; Soybeans are in a pullback which began exactly the day after I sent out a free newsletter about it:

JEANNE LONG STUDY
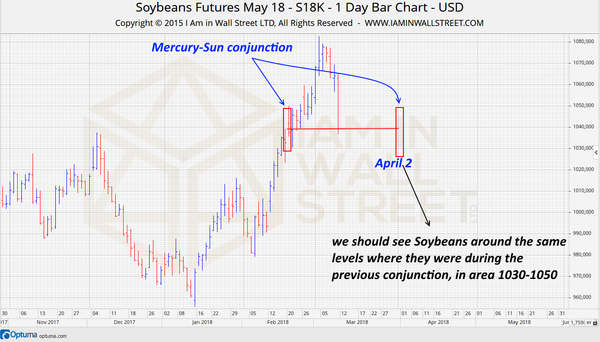
How did I do that? The following study is not something I use, but I do something similar; the study of Jeanny Long was suggesting lower levels because Soybeans should be, statistically, in area 1030-1050 on April 2, 2018. Hence, considering I had cycles suggesting a pullback in March, and considering Soybeans were at 1070-1080 at the beginning of March, it was easy for me to call a pullback where, statistically, Soybeans should be around 1030-1050 on April 2, 2018. This study worked correctly 4 times our of 5 during the last 18 months, which is not a bad statistics at all! Plus, this study is telling you the price area where Soybeans will be!
OK, CAN YOU TELL ME THIS STUDY?
Here I am! The study uses planetary cycles, hence, if you do not believe it, just fly away 🙂 I believe in numbers, and if numbers are correct, I can even believe in a cow giving me numbers as long as they are correct. I believe in what I see, and this is what I see.
Looking at the planetary system from the Earth (Geocentric View), we can see planets overlapping each other. When two planets are on the same line (one planet is right behind another planet if we look them from the Earth), they are called to be in conjunction. I am not going to open a lesson of astronomy (I said astronomy, not astrology!). Anyway, for our purpose, I take the Sun and Mercury. When these two planets are in conjunction, we should notice the price where Soybeans are on that day, because during the next conjunction, Soybeans should be at the same level where they were during the previous conjunction (statistically). In this way, I am expecting to see Soybeans around 1030-1050 during the next Conjunction between the Sun and Mercury:
Do not look at it as black magic, astrology, lord of light (Game of Thrones LOL); I suggest you having a very easy approach, scientific: test it, and see how the statistics turns out; if it works you better use it, if not, you better don’t use it.
In the following Charts I show you the last five results of this study:


CONCLUSION
I am not teaching any new study or trading tool! I will never base my trading on this kind of tool! But, I look at these interesting analysis, because they can help me to understand where and when the Market should go; they can confirm my main analysis. When I open or close positions, I use a totally different strategy. With this Newsletter I what to give you some thoughts for your brain. Looking at these studies you can come up with something useful, above all if you go deeper, lookig for “coincidences”. I said we had to see a stop of the uptrend in the Soybeans Market, and so it did. This study was supporting my forecast. We will see, in April 2, if Soybeans will be in area 1030-1050.
I know you are too smart to believe in the Sacro Graal of trading. Trust me, this is not the Sacro Graal, there is no Sacro Graal. If you test this study in the past, you will see it is not able to provide a positive statistics of 80% as it did in the last 18 months. But it can really help, and if you begin study, you discover there is much more to know; you only have to begin somewhere.
Hi Daniele,
In regard to the example of the failed soybean forecast using Jeanie Long.
If we use the wheel of 24, 1080 is at the end a complete cycle using $1 per space ($24 around the wheel once)
Minus 1 $24 cycle brings to 1056. Exactly where the time said it would be, just 1 price cycle lower.
Hi again, CORRECTION,
I don’t know what I was thinking, the numbers are all wrong…..sorry.
However, the practice is correct
1080/24=45 cycles around the wheel of 24
960/24= 40 cycles around the wheel.
Price was where time was, just 5 exact cycles lower.
(as Jeanie explains in her book)
Hi David, very nice job! I see you are keen on cycles. The more you look at the Market and the more you see these geometries, well done! The problem often is the confusion I have when I use too many tools. Jeanie’s work is very nice, and it can help to plan good trades.
Hi Daniele,
Would you please elaborate similar technique, one which demonstrated for soyabean (Sun-Mer), for Stock index?
Hi Mohan,
yes, I can, anyone can 🙂 I am focused on my own researches right now, but you can do it on your own, it is very easy; you just study the past using the similar technique and you see how it works; in this way you create a statistic and you can decide if you may use it for the future. It requieres a lot of time time, hours, but unfertunately I do not have all that time right now.
Hello
do you offer courses to teach?
Thank you
Hi Jannie, thank you for your interest. I am working right now on a new course, it should be available next year. I have two courses, but they are a little old. Here is the link: https://www.cosmoeconomics.com/EZ/ice/ice/daniele-prandelli.php