
Soybeans Pattern of the Futures
- September 4, 2018
- Posted by: Daniele Prandelli
- Categories: Soybeans, Trading
The Soybeans Pattern to know when the downtrend is over
If you know our work, you know we believe the Market repeats itself, and we gave proof of it with tons of studies and examples over the last years. This is another pattern we are monitoring, and it can tell a lot about the trend of Soybeans
What is a pattern in Technical Analysis?
I can use my words, which I will, but we can also refer to Wikipedia to learn what a pattern is. I really suggest doing it because it is inspiring. Plus, you probably do not know, but many fields and sciences are built on patterns, for example in medicine.
In trading, the pattern is a condition, a movement or a mixture of movements that repeat themselves over the time. If we recognise a pattern before it ends, we can predict what it is going to happen next, looking at the same pattern in the past. Even symptoms in medicine are patterns that Doctors use to find the possible illness. Doctors are not always right, and the same is in trading (fortunately Doctors are better than traders in recognising patterns)!
We see patterns when there are movements, conditions, cycles that repeat over the time. When the same condition happens again, we can predict with a high rate of success what happens next. This is not hard to understand, and you probably already use patterns; if you think at the Head and Shoulders Pattern, that is what I am talking about… well, just to make you understand what I mean. We look for something deeper than that, usually; something more reliable.
The Actual Soybeans Pattern
Talking about Patterns, we can write an entire book, because there are many things to talk about. Today, we just want to share with you an interesting Price Magnitudo Pattern, you may find it interesting. We will sum up the conclusions later.
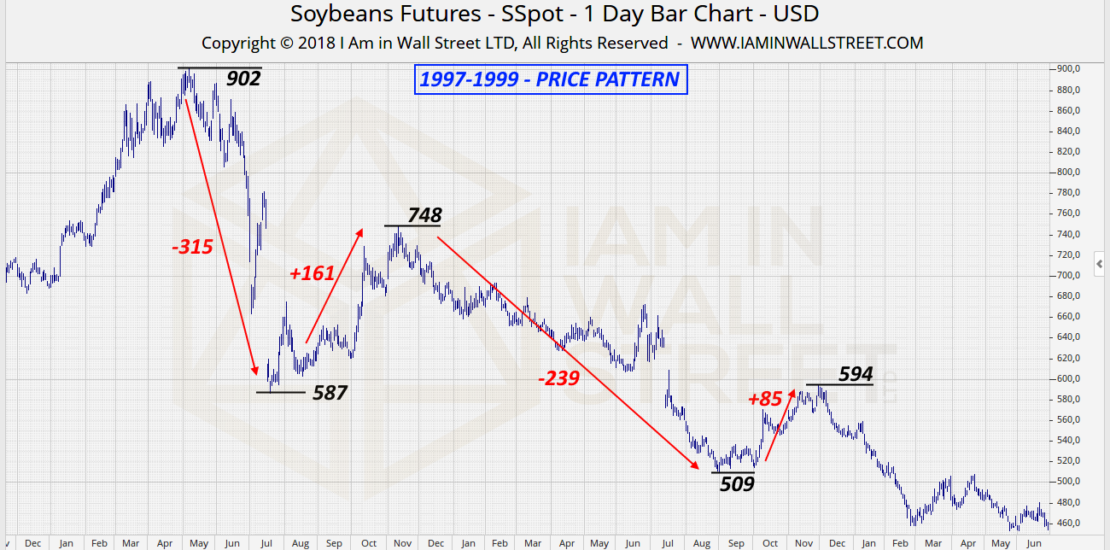
In the following Chart, you see the Soybeans Spot Chart in the period 1997-1999:

The following Chart shows the actual Soybeans Spot Chart, from 2016:

I hope you see the similarity of the supports/resistances regions! Quite amazing. Soybeans are finding supports/resistances at the same price magnitute of 19 years ago:
- 315 – 308
- 161 – 170
- 239 – 259
- 85 – 95
These are the swings compared between the two different periods. They are following a similar pattern. Now, we can believe it is going to work forever… or maybe not… mmm… What do we really know from this study?
Summing up
Remember that when we recognize a pattern, we follow it as long as it is not broken! It will not work forever, of course! I know you are already forecasting Soybeans at 770 or even at 717. This is not a book, this is a real life; we see this pattern suggesting area 900 as important, and a significant drop should start (we did forecast a drop from 900, that’s why we provided the opportunity to open SHORT positions under 900 through our Reports). We can guess that, if the pattern goes on, we should see lower levels. It does not mean we can now master Beans like God (as books want to teach you).
After these data, we create the strategy. The question is: when is the pattern broken? Obviously, when we see a movement above the High 906 (Spot-Chart). That is the signal; that is when probably this negative phase will end. Until that moment, our studies suggest a continuation of weakness, or at least a sideways movement under 900.