
S&P500: how it repeats itself
- February 5, 2018
- Posted by: Daniele Prandelli
- Category: S&P500
The S&P500 Index saw a higher volatility in the last days, something that is scaring the Bulls. Is the uptrend pattern still alive?
LOOKING AT THE PAST
S&P500 1982-1987

There is something wonderful in this pattern: the biggest pullbacks in the period 1982-1987, before the crash, were all inside a range of 28 points. The rectangles you see in the chart have a height of 28 points, and we can appreciate three pullbacks, all around 28 points! I am not saying that one has 10 points drop, and the next one 28, I am saying that all the three pullbacks were almost perfecty of 28 points. The 1987 crash began after the S&P500 tried to remain inside this pattern. The breakout over this pattern was the beginning of the real crash.
S&P500 1988-1989

Here we see again three pullbacks, everyone around 24 points; in the last phase, the uptrend accelerates, and in October 1989 we see a pullback larger than 24 points; this is also the end of the strong uptrend, and a new sideways pattern began ending in a Low in 1990, but no crashes.
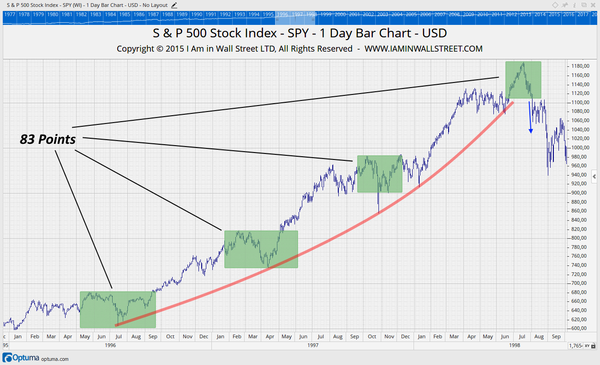
S&P500 1996-1998
The pattern of the pullbacks are not that precise as before, but we can see similar pullbacks around 83 points. In October 1997 we see a fast movement over the 83 points rectangle, recovered right the day after. A stronger down movement began only in 1998, when the S&P500 moved over the green rectangle with the pullback; you can see the acceleration over it, and the beginning of a severe drop. That was just a fast little crash, because after 3 months the S&P500 had already recovered all the losses.
S&P500 2003-2007

In this period, we see an easy 100 points pullback pattern, which was very precise in 2004 and 2006. In 2005 the pullback was about 94 points. Even here, the first alert came from a drop over 100 points, in July 2007. We all know what happened then, a very strong drop began. But the Market did not crash straight away, we see a new top in October 2007, and a downtrend with swings until September 2008. In October 2008, we saw the crash.
WHAT HAVE WE SEEN?
- during parabolic patterns, the pullbacks have the same magnitude, and a movement over that range can definitely suggest the end of the uptrend.
- when the uptrend is over, it does not mean we have to expect a crash straight away. Only in 1987 it happened, but in the other three situations we considered, it took time for the downtrend to begin. In 1989 and 1998 we did not even see the beginning of a new downtrend, because the Market accelerated down for the following months, but the main trend remained always the uptrend.
CAN WE USE THE SAME STUDY FOR THE ACTUAL MARKET?
Obviously, that’s the purpose of our studies! If we consider the last year, where the parabolic pattern is evident, we see two similar pullbacks:
- March 2017 = 78 points
- August 2017 = 73 points

This is a short time compared to the studies we made before! But the pattern is clear, and we saw the strongest down acceleration once the S&P500 moved under 2800 points, the area where we could see the support in case the Market maintained the “75 points pullback pattern“:

- 2011 = 296 points
- 2015-2016 = 325 points

Almost the same, considering these are the two largest drops of a period long 9 years.
CONCLUSIONS
- the parabolic pattern of the 2017 has been probably broken after the breakout and down acceleration under 2800 points.
- if we see the drop to continue from the top of January 2018, we should pay attention to a possible support in area 2545-2576 points to maintain the uptrend that lasts since 2009.
- we should not rush in opening mid-term SHORT positions, because Markets usually develope a sideways movement or new intermediate tops before a strong crash.
- In the situations where the downtrend began immediately, that movement did not last long; we can expect the same from the actual drop.