
Do not forget the Benner Fibonacci Cycle
- October 24, 2018
- Posted by: Daniele Prandelli
- Categories: Economics, Forecast, S&P500
The Benner Fibonacci cycle is a well known study, published around 1967, and one of the few studies that have been quite precise even after it went public.
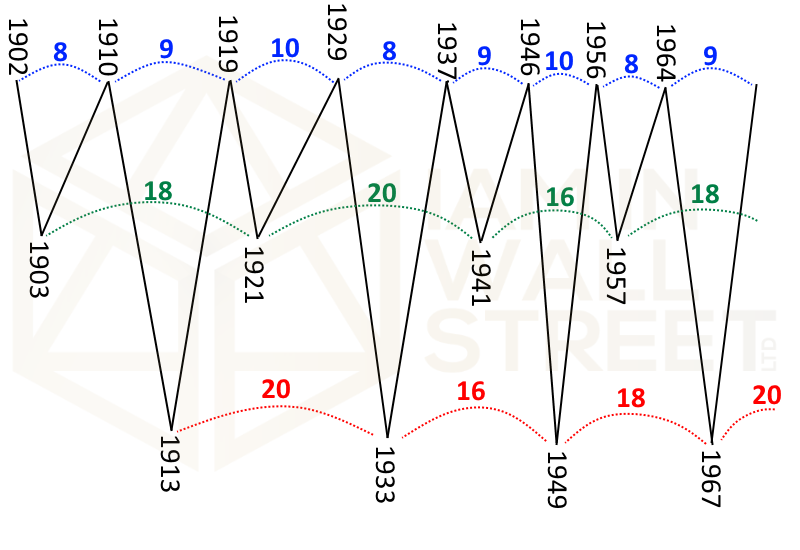
The original Benner Fibonacci work of Samuel T. Benner went public around 1967, which stated this:
- Tops every 8+9+10 years starting in 1902, and then this cycle keeps repeating itself (8+9+10+8+9+10…)
- Bottoms every 18+20+16 starting from 1903 and from 1913, and then this cycle keeps repeating itself (18+20+16+18+20+16…)
A simple image will better explain what the Benner Fibonacci cycle is:

If you look back with the Dow Jones Industrial Average Chart, you will see how this cycle has been a great cycle! However, we want to know if this cycle can be useful to us, nowadays. Ok, this is how the Benner Fibonacci goes on:

Believe it or not, this cycle has been able to forecast the strong uptrend that began in 1995, the Top in 2000 and the Low in 2003. The Benner Fibonacci is now suggesting a High right in 2018! This is something to consider, I guess. Any tool to understand, or have a kind of confirmation that this study is right? Please look at the S&P500 Pullback Pattern Study, it may be very useful.
Hi,
It seems to have missed 2008.
Best Regards
Lars
You are right! As every trading statistics: good but not perfect 🙂