
S&P500 – Pullback Pattern Study Update
- October 30, 2018
- Posted by: Daniele Prandelli
- Categories: Forecast, S&P500, Trading
Do you remeber the Pullback Pattern Study we made on February 6, 2018? It is time to have a look at it
What did we say on February?
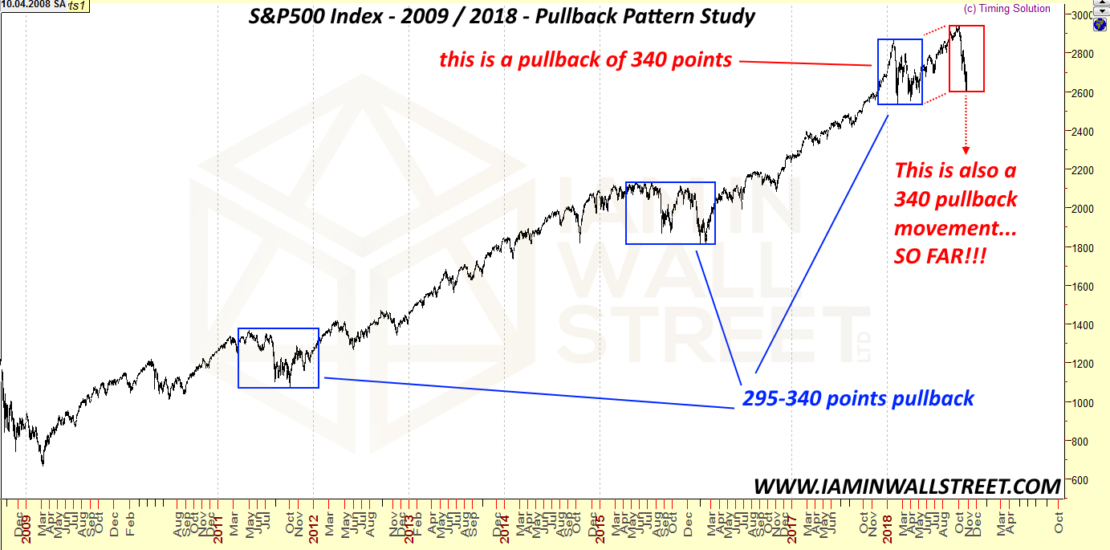
We provided a free analysis, where we studied the past to understand if there was any pattern in the most important pullbacks during the long-term uptrends. What we found was very interesting: the magnituto of the pullbacks were quite the same. To better understand the study, please read S&P500: How it repeats itself. With this study we have been able to forecast quite precisely the Low of February.
This is the chart we published in the analysis:

As you well know, the Market did a Low at 2534 points, only 11 points under the area we did forecast as a possible important support to maintain the uptrend structure.
After the last descent, where is the S&P500, considering the Pullback Pattern Study?
Well, this is the important question! I believe we are at the make or break level now! If we update the chart of the S&P500 taking into consideration our study, we see how important can be the Low of October 29:

It is so evident that the Low of October 29 at 2603 points is very important, and I pay attention to it to understand if I may start opening SHORT positions, or I can keep working with LONG positions.
Do not forget this is just a study based on statistics, and nothing is sure. Everything can always happen.