
New uptrend after the bounce? I have doubts about it
- June 8, 2022
- Posted by: Daniele Prandelli
- Categories: Astro Trading, Gann, S&P500
The S&P500 hit a quite significant Low, in May. The eternal doubt is if this is the beginning of a new uptrend, or if this is just a pullback to continue a larger downtrend.
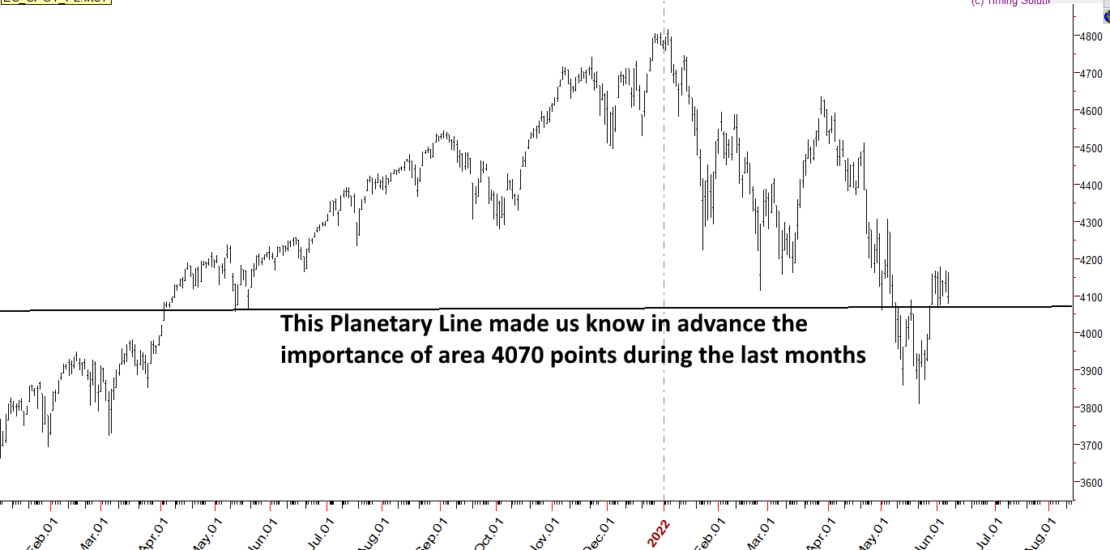
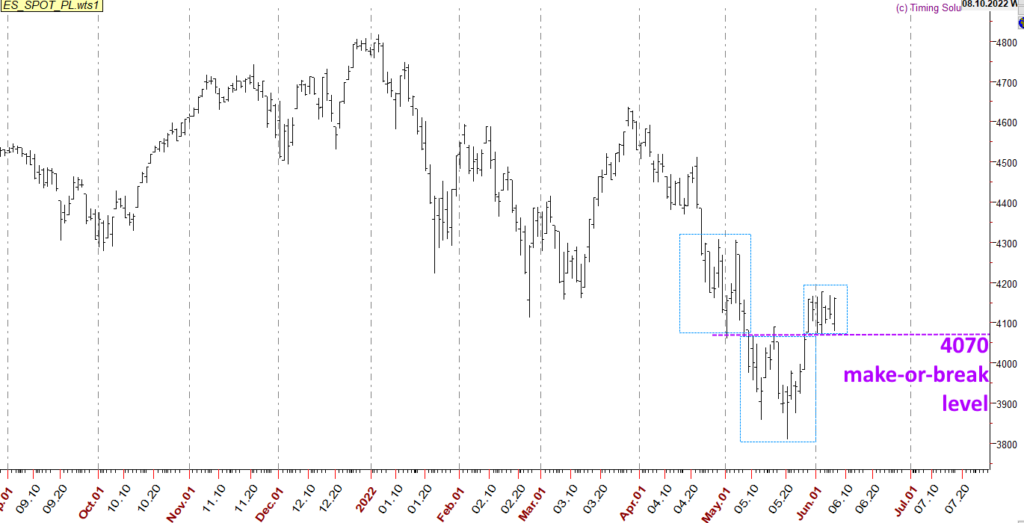
From my point of view, the Stock Market did not hit a significant Low; my eyes are more on a price that has been broken during the fall, and then recovered with conviction. Here below is the S&P500 Daily Bar Chart, trying to explain to you why my eyes are on the level at 4070 points:
The meaning of the level at 4070 points is important. However, I mentioned it to my subscribers before we could see it working as a make-or-break level, and the reason is that I have a precise Planetary Line that I always monitor for my trading activity. So sorry that it is not considered a Planet anymore 😉
Here is the Planetary Line I have been working with:
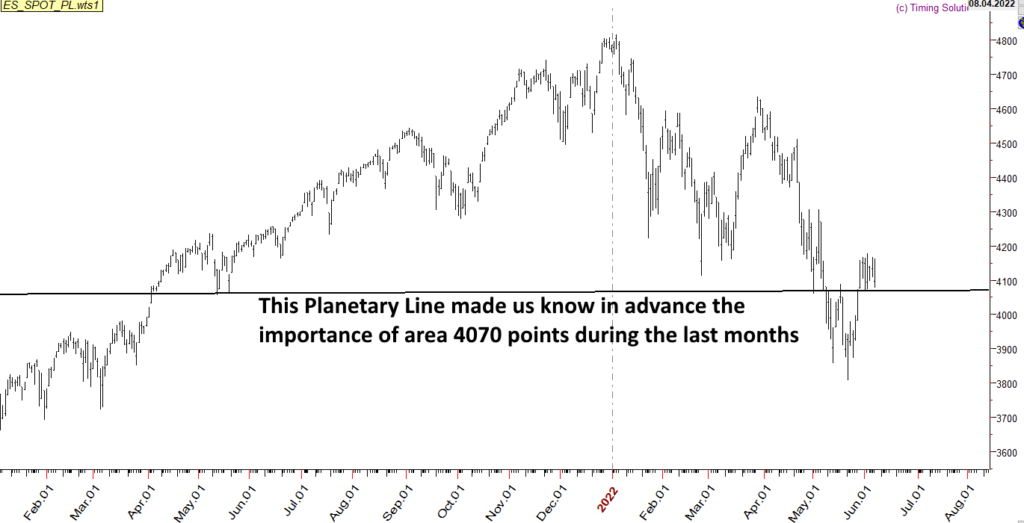
Thanks to this Planetary Line, we were able to work nicely, holding SHORT positions under it (we are working with SHORT positions from much higher levels anyway), and after taking some profits, we protected the remaining SHORTs with a stop above 4070 points.
The S&P500 chart with the Planetary Line explains why I am paying attention to 4070 points; under this level, we may have a clue that the Stock Market may be in a weak position, a kind of confirmation that I always work with to start a trade.
Does it mean we are in an uptrend now?
The movement above 4070 points is “one reason” to consider the S&P500 in a strong position. But I must say that my timing analysis does not suggest the month of May as the best timing of the year for a new uptrend. We may see a bounce, but I have doubts this is the beginning of a new uptrend. I would not be surprised to see a new drop, even under May Lows.
The next Key Date for the Stock Market to make a decision should be imminent, and once it arrives, we will be ready to read the next pattern to probably create a strategy to SHORT again. The S&P500 may remain up just a bit more before being back in a downtrend. I just need to wait a few days.
In any case, if the pattern is not clear, I can always wait for 4070 points to SHORT under it and protect the position above it.
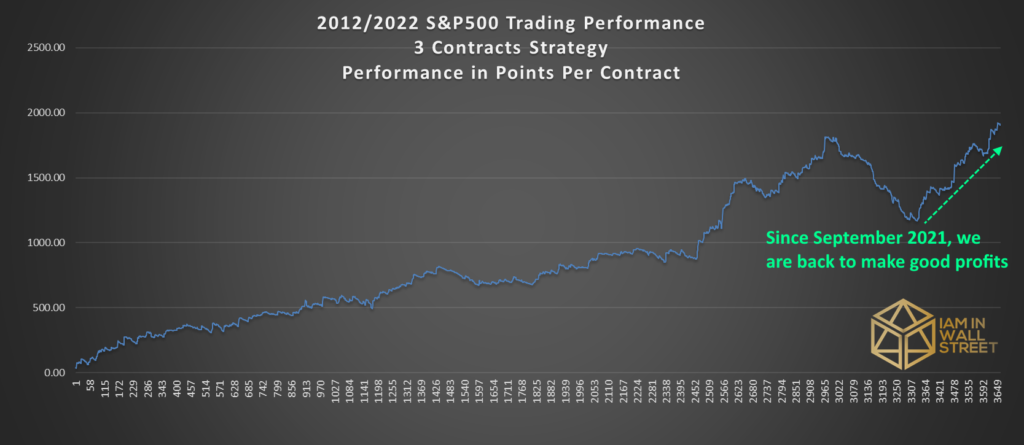
Is my trading performance back to work successfully?
If you read my previous posts, you are probably wondering why you should keep reading them, considering that I confessed I had some troubles in trading the S&P500 in 2021. That’s true, as I explained in the Post “I confess my bad 2021“; after 9 years of profits (2012-2020), I had to face one year of loss; but I told you, I found the glitch, and I promised that I would have been back to my good performance, making even better than before. As I was transparent in sharing with you my problems in 2021 (no reason to hide it considering that my Subscribers see day-by-day my work), now I am happy to state that we have recovered from the bad period I had in 2021, and since September 2021, we are in profit of about 730 points per contract (while the S&P500 is 400 points down since then).
Daily Report Service Monthly Subscription available
If interested in the Daily Report Service, now you can subscribe to it with a Monthly Subscription. I notice that the Quarterly Subscription for this service was not so popular, hence, I have decided to open again the possibility to use a Monthly Subscription; click here below for more details.