
Corn Pattern – Time for a pullback
- October 17, 2018
- Posted by: Daniele Prandelli
- Category: Corn
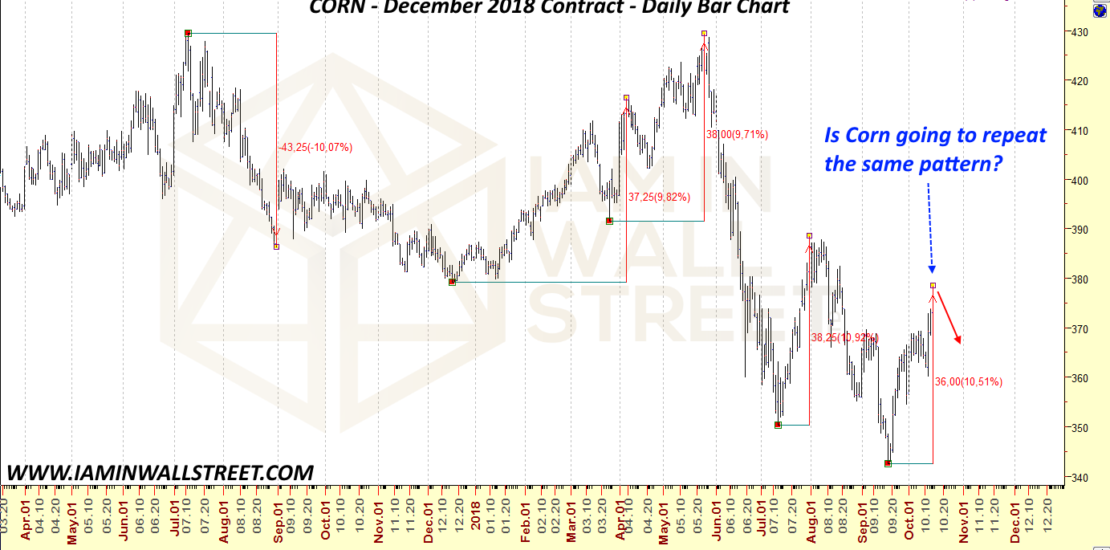
Why should you expect a pullback of Corn Prices
The Pattern of Corn, with the December Contract, is evident: we see many swings that moved with an average of 10%; once Corn reached this movement, we often saw a pullback. Trading Corn everyday since 2012 in our Daily Report Service, we have learnt how this Commodity has the tendency to create patterns that repeats over the time. The Chart shows here why we are now expecting a new pullback of Corn price, thanks to a specific pattern:

With a simple but powerful analysis of patterns, we do not need words to explain what we mean. We opened SHORT positions in area 378, and we keep it as long as Corn remains under this area, until our cycles and price targets suggest to do it.
Be aware, nothing is sure! We study the Market to increase the chances to follow the right direction, but then we always have to use precise strategies to manage the position.