
S&P500 Forecast: I told you, but I can say more…
- November 13, 2018
- Posted by: Daniele Prandelli
- Categories: Forecast, Gann, S&P500
It looks like the Post I sent you on October 30, 2018, nailed the target! Hence, again, we have been able to provide you the right time to buy, and that’s impossible to deny.
But I can say much more…
Please, let me promo a bit the good work we did during the drop of October. We have 20 subscribers to the Daily Report Service and 5 Subscribers to the Weekly Report Service that can witness what I said, from October 15: “we should see a new up push starting from October 27“. Also, on October 22, I said “I wait for the next possible change in trend, around October 27“.
This is the Forecast I sent to the Daily and Weekly Report Subscribers, on October 15:

But I can say much more…
In the 2018 S&P500 Bulletin Service, I sent out an Update (we sent out 6 Updates during the 2018, with this Service), where I said:
“My favorite forecast suggests a Low around October 27” (which means October 26-29, because the 27th was Saturday).
“Important levels: Area 2602 Index Points – not always precise, I do not use it”
The forecast is perfect, as you know, and also the price (even if I have not used it to trade), has a strong significance.
Why did I say that the level at 2602 points is not always precise? Because, at this level, the energy is not always very good; it could be hard to trade precisely, based on it. Instead, this time it worked very well. This is another demonstration that we work with very reliable tools.
However, again, I can say much more…
Believe it or not, but I have about 10 subscribers to the 2018 S&P500 Bulletin that can witness what I showed in December 2017, when I made the 2018 Annual Forecast:

This is the PFS (Polarity Factor System) Forecast Model, a very important tool I use to forecast the polarity of change in trends.
As you can see, we have two lines, both suggesting a Low and a new up push on October 27. (That is the main reason I said to wait for this date).
In the 2018 S&P500 Bulletin, I marked several dates where up pushes were expected (with a rate of success of 80% +/-, statistically), and between these dates, we have October 27! Nothing magic, just a deep knowledge of the Market and the tools we use to develope our trading plans.
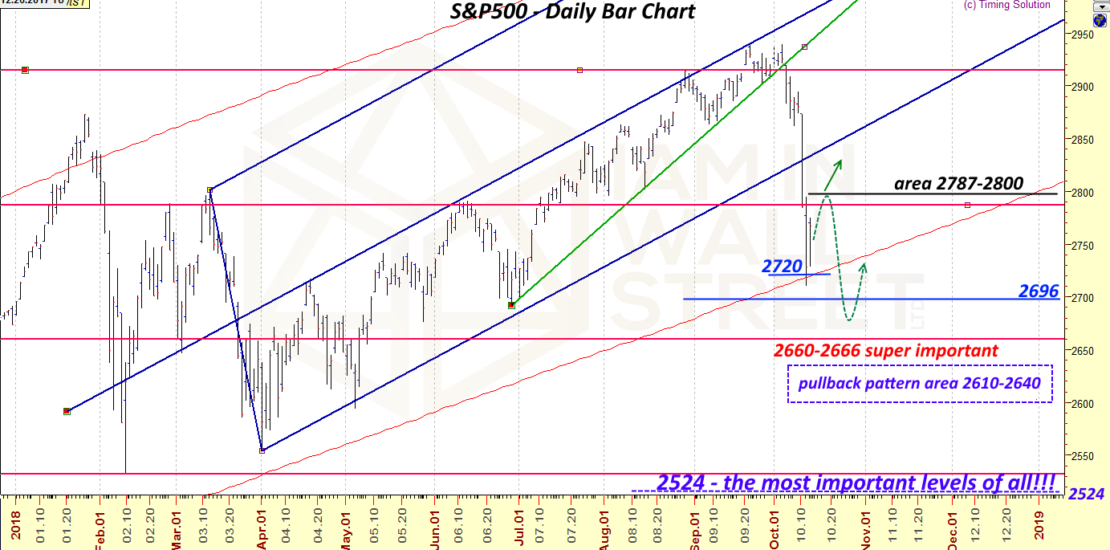
What’s Next?
I can say more… Am I worried about the descent of the last days in the S&P500? Nope… but there are some important levels to monitor now. I am not expecting any new Low, otherwise that would be really dangerous (look at the Pullback Pattern study to understand why). I think we will see a new important up push; however, the price map is always the most important thing to trade with an intelligent strategy. If you do not understand it, and you keep trusting just in forecasts… I am sorry for you!
New policy to subscribe the Daily or Weekly Report Service
If you are interested to our Daily or Weekly Report Services, there are still 5 Subscriptions available (I do not accept more than 25 Subscribers to the Daily Report and not more than 10 Subscribers to the Weekly Report). This is a new policy I adopt, to have serious traders and long-standing relationships in a service where I give a lot, every day; this is also a way to not spread out too much my personal work, which I want it to remain for few, and not for many. I will talk more about this new policy in the future.
For the 2019 S&P500 Bulletin, it will be available by the end of November. We accept unlimited subscriptions to the Bulletins.